Over the last two blog posts, I have looked at student scores by grade over the years of 2019-2022 and then compared the scores of my students to the school’s average scores. Today, I want to dig into differentiating your focus.
Read –> We did the test. Now what? Part 1: Looking at yearly performance over time.
Read –> We did the test. now what? Part 2: Year-over-year comparisons and data analysis.
Looking at Specific Students Over Time
Just as you can compare your classes’ results year over year, you can do the same for your students. I use these data trends to honor my “best students” at the end of the year. Besides “Most Proficient,” I have a data-based “Most Improvement” winner. Here is an example of how to work with longitudinal data for a single student. I’m using actual student data but have changed student names/initials to protect privacy. This specific student, whom we’ll call CW, was the second-most improved student in my senior-level College Credit Plus course this year.
To start, simply use the AAPPL Longitudinal Report and export it to Excel. If this isn’t enabled in your LTI Client Site account, contact your LTI representative and ask them to enable AAPPL Student Longitudinal Reports.
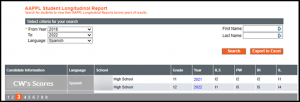
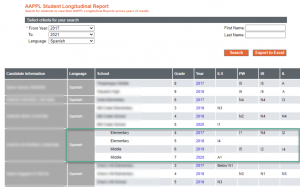
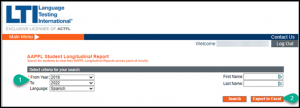
To run your AAPPL Student Longitudinal Report, simply select the timeframe and language. You will get an output like the one below, which will include a list of multiple students and their scores across years of testing.
While this example shows longitudinal data for all of my students in the year range and language I specified, I can also search for a specific student. Let’s take another student whom I’ll call JH, for example. In the general output, I can see they showed signs of improvement (see screenshot below).
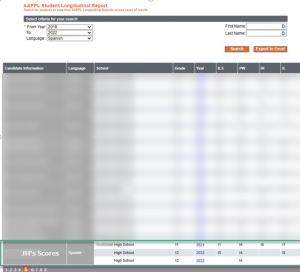
Perhaps I want to isolate their scores and drill down a bit or maybe even sit down and show them their scores on my screen to discuss together. To look at a specific student, I enter the student’s name (in this case, I entered JH’s name) and click search; this generates an output like this example below.
Looking at Broader Trends
As you look at longitudinal data, you are able to see trends across years. It can be interesting to look at the changes and patterns from elementary to middle or middle to high school, as you see in the example below. Your ability to view across schools or grade levels will depend on the viewing access set up with your username in the Client Site. Longitudinal reports can empower you as a teacher to become familiar with students’ AAPPL data prior to coming to your grade level or your school. This can also empower teachers and administrators to see patterns in programs across a district or multiple schools.
Playing with Data
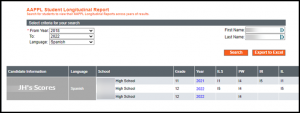
When you look at the longitudinal reports, you also have the option to export the data to Excel. Simply enter your year range, language (Bubble 1), hit search, and then select Export to Excel (Bubble 2). This will allow you to conduct further analysis of the data if you’re comfortable with Excel and its functions. You can look at the data within a year, year over year, by years of instruction, and more. It might seem incredibly time-consuming to evaluate data like I’ve shown in this series of blog posts. But doing so has helped to inform my instructional strategies, recognize student development, and drill into specific points that might be important.
You can use AAPPL data to benefit your own instruction or even go beyond that to working with your school, program, or district. The first step is to take a look together with your colleagues and re-center the discussion around proficiency. Then it’s easier to all pull in the same direction! Our department has done more and more of this since our adoption of the AAPPL. Not only am I improving in my instructional strategies, but as a department we are all paying attention and working to aim our trajectory higher. As you dig into longitudinal reporting, you might be surprised what trends you find. The data can provide powerful information that can significantly impact the work you and your language departments do!