
We love to use the AAPPL test for our students to earn the Seal of Biliteracy, but to refine our program and to recognize growth as well as achievement, we have explored the data reporting tools that the LTI Client Site has to offer. In this article, I will discuss a few of the ways that you can use this data as evidence to differentiate instruction, change curricular focus, and even to supplement your teacher evaluation rating. While some of the data analysis can be done directly within the LTI Client Site, you can also export student data to do a deeper dive using a spreadsheet.
One of the key ways that you can use the data is for longitudinal comparison of your students’ performance versus their own prior performance; you can also look at performance in your current year and previous years. Below I will demonstrate a few examples of how you can do this, as well as a breakdown of what our thought process around this information has looked like for our district specifically.
Refine Your Year Over Year Performance
For this example, I will produce tables for each of the four years that we have given the Spanish-language AAPPL, with a comparison of juniors and seniors. (We test during Seal of Biliteracy eligibility, which in Ohio is within 15 months of graduation.) Then I will repeat this for myself as a teacher and compare my students’ results to our school’s overall results.
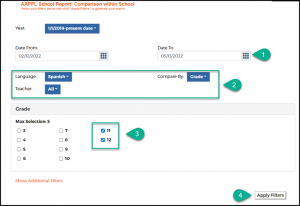
- From the Main Menu, click AAPPL School Report.
- Select your date range, Language, Teacher, and
- the value that you wish to Compare By followed by your selected parameters.
- Click Apply Filters to see your data.
Digging in: Performance by Grade Over Years
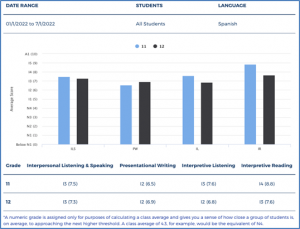
Taking the filters I just set, I’ll first look at performance by grade, starting in 2019. The following images show AAPPL Data for Spanish students in grades 11 and 12 by year, starting in 2019.
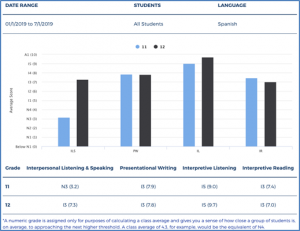
In Figure 1, you can see that the 11th and 12th graders are hovering in the intermediate range, with the exception of the ILS where the 11th graders had a notably lower average rating.
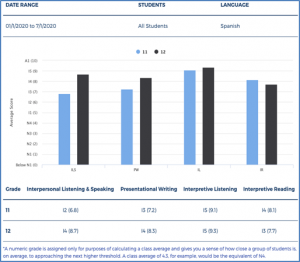
A year later, in 2020 (Figure 2), I see that the grade 11 students are achieving a higher average rating on the ILS than the previous year, now nearing I3 instead of N3. I also see that, overall, both 11th and 12th graders are achieving higher ratings than the previous year.
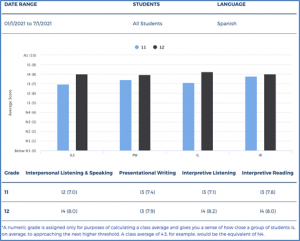
In 2021 (Figure 3), I can see lower average scores across the board and can consider what was different in this academic year from previous years.
I again see evidence of lower average scores across the board in 2022 (Figure 4).
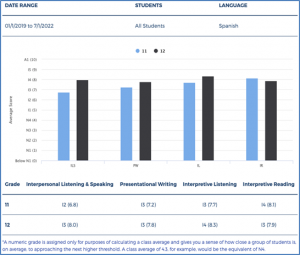
Figure 5 shows combined scores for all three years and allows me to get an overall snapshot of my 11th and 12 grade students over a period of time. I can compare this combined score over 3 years to any individual year, and I’ve now created my own norm-referenced internal benchmark.
This simple example of looking at students by grade over a series of years gives a glimpse into how useful longitudinal reporting can be. In my next post, I’ll dig into some analysis as I do a year over year comparison using the longitudinal data.